Call analytics application user guide
Overview
Call Analytics provides a business with a web-based reporting package that allows them to run and email reports on all aspects of calls made, attempted calls, received calls and missed calls. Likewise it enables this call data to be presented in live visual Wallboards for Call Centre operations.
The application portal comes with standard branding and cannot be branded.
This application is available on the following WHC technologies:
Centrex Users
- Functional – Desktop only
- Fixed - All
- Mobile - All
SIPT Users
- Functional – Desktop only
- Fixed - All
- Mobile - All
Application Description – WHC Call Analytics
WHC Call Analytics provides users with a mobile-optimised suite of call analytics that can be accessed via any web browser. There are 3 core modules available and only one can be used at a time, as you upgrade, you gain the functionality from the previous package.
- ICS insight
- ICS report
- ICS report premier
iCS insight
ICS insight is a business productivity tool delivering powerful call data visualisation via a predefined dashboard and wallboard.
Intuitive dashboard
The at-a-glance dashboard monitors performance to visualise call activity such as:
- Hourly / Daily call distribution
- Call activity by DDI/extension/user
- Missed call summary
- Unreturned missed calls by caller ID
The pre-configured wallboard displays key business metrics (DDI, user and business summary).Business wallboard
iCS Report delivers enhanced-level call reporting and analytics. Access configurable dashboards, wallboards and detailed reporting. Run and schedule reports.
iCS Report features include:
- Schedule reports for ‘yesterday’, ‘last week’, ‘last month’ or custom dates.
- Browse an extensive catalogue of reports or use filters to customise your own. Report on call activity by extension, department, hunt group, DDI and user, including total calls, destination, talk time and ring time.
- Incoming call analytics measure call volumes, targets, grade of service, percentage calls answered, call abandoned, longest waiting and unreturned missed calls.
- Executive reports collate data from multiple reports, and provide observations & recommended actions.
- Customised dashboards and wallboards.
iCS Report Premier enhances the functionality of iCS Report by adding live call statistics and monitors contact centre queues and agents. Monitor call activity via live dashboards, reports and wallboards for up to the minute contact centre analytics and granular reporting.
iCS Report Premier features include:
- Real time reporting; live calls waiting and call handling statistics by agent and ACD call queue. Report on total calls, destination, talk time, ring time, grade of service, percentage calls answered, number of calls in queue, call abandoned, longest waiting and unreturned missed calls.
- At a glance dashboards and wallboards display group performance parameters on a live tile.
- Live call statistics for queues and agents, such as number / duration of calls and availability.
- Supervisor management tools including agent presence monitoring.
- Review performance and use “what if” calculations to forward plan contact centre agent shifts.
Hardware & Software Description
In order to successfully install and use this application, the following installation and licensing requirements should be met:
The web application has no operating system pre-requisites.
The portal has cross-browser support and will work on the following web applications:
- Internet Explorer 8.0 and higher
- Firefox
- Chrome
Network and Firewall Requirements
You may need to allow access for the following on your firewall:
|
Protocol |
Destination |
Destination Port |
|
HTTPS |
icscallanalytics.yourwhc.co.uk 40.115.5.58 |
TCP 443 |
Contact sales@ic.co.uk to order the product.
Using the portal
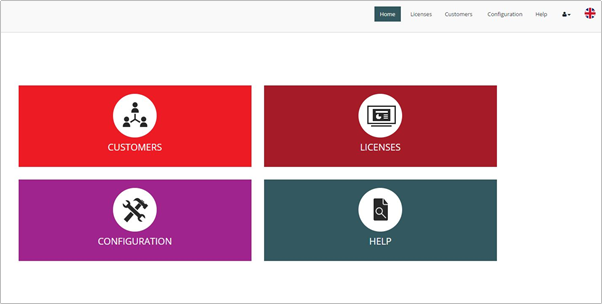
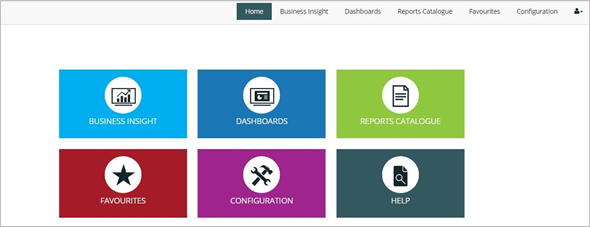
The home screen presents menu options in both a top menu bar and large icons. Language options can be selected using the flag icon.
Within Licenses, the user has the option to view a License Summary dashboard. The ‘License Summary’ is a dashboard displaying key metrics on the number of tenants and end points provisioned, those added/deactivated this month and details of licenses allocated.
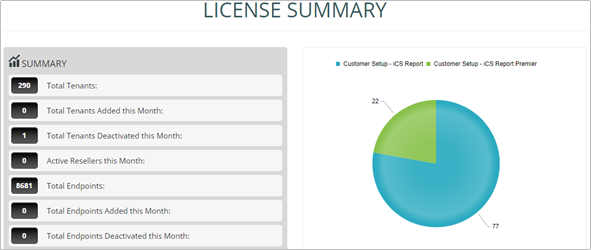
In the right hand-corner you will see a pie chart which will show the percentage of Company’s established on the three core reporting packs.The following statistics are available:
- Total Tenants – total number of WHC Company’s built include accounts that are not active.
- Total Tenants Added this Month – total number of WHC Company’s built this month.
- Total Tenants Deactivated this Month – total number of WHC Company’s ceased this month.
- Active Resellers this Month – total number of resellers that are active this month.
- Total Endpoints – total number of end-users being monitored.
- Total Endpoints Added this Month – total number of new monitored end users that have been added.
- Total Endpoints Deactivated this Month – total number of monitored end users that have been deactivated
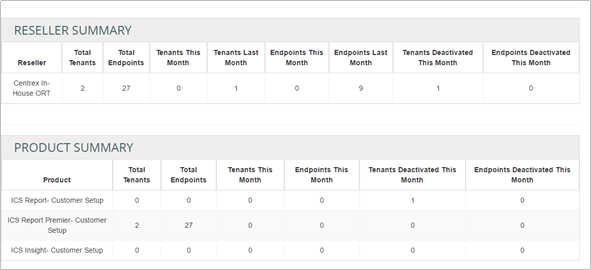
In the top-half, Reseller Summary, you can see similar information as displayed in the top half of the page:
- Total Tenants – total number of WHC Company’s built include accounts that are deactive.
- Total Endpoints – total number of end-users being monitored.
- Tenants this Month – total number of WHC Company’s built this month.
- Tenants Last Month – total number of WHC Company’s built last month.
- Endpoints this Month – total number of end-users being monitored and added this month.
- Endpoints Last Month – total number of end-users being monitored added last month.
- Tenants Deactivated this Month – total number of WHC Company’s ceased this month.
- Endpoints Deactivated this Month – total number of monitored end users that have been deactivated.
In the bottom-half, Product Summary, you can see a breakdown of the same information listed above, but against the 3 product types.
If you click on the View Customers button you will be presented with the following screen:
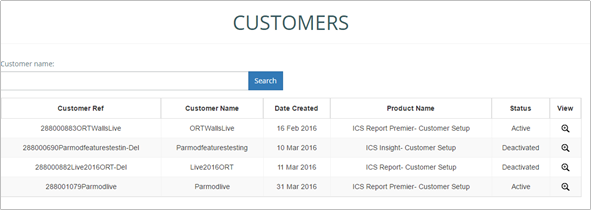
Go to ‘View Customer’ to view a list of customers, edit customer details or search for a specific customer. The list of customers displays the customer reference, name, date created, product and status (active).
Customers can be deleted or activated from this table, logins can be viewed and customer details can be edited.
By clicking edit, full details appear including contact details, system details and license information. License quantities can be amended (upgraded, downgraded or new modules added) and saved.
This is a summary page of the Companies you have set-up with Call Analytics along with the package they have taken and their activation status. If you click on the View button you will be presented with the following screens which just provides more granular detail.
Once Call Analytics is complete, a New Customer Set Up email, followed by a Password Separate email, is sent to the nominated Company administrators, as noted on the order form. This email will guide them to the WHC Call Analytics application portal where they can login using their supplied credentials.
Once in the portal, the administrator should select Configuration to set-up more Users, where they have requested additional admin accounts. If they are the only one using the portal then this will not be necessary.
Configuration is then divided into:
- User (includes extensions, divisions, department, cost centres, sites)
- DDI
- Customer
- Logins
- Tasks and Actions (Scheduled Tasks)
- ACD Groups
- Accounts
- Call Accounting
- System Settings
- Compliance
User
This section allows users to add, edit or delete extensions, divisions, departments, cost centres, sites and to upload a directory.
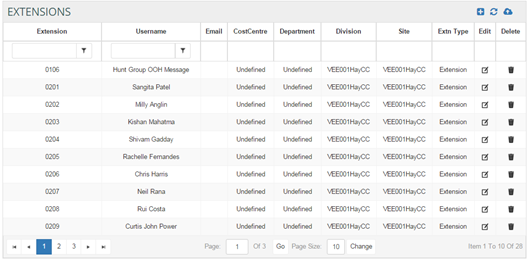
Extensions are automatically detected when a call is made to or from an extension. Once they are detected, the extensions from the phone system synchronise with the software, so there is no need to manually add usernames, cost centres, departments and divisions to extensions.
It is also possible to synchronise manually using the Broadsoft Sync and Database Sync buttons:
- WHC Sync (Broadsoft Sync): All extension information such as extension number, name, department and site can be synchronised from the WHC Broadworks directory into the call reporting portal using the Broadsoft sync option. This sync feature is automated and scheduled to run every 4 hours.
- Database Sync: A database sync will add all extension numbers into the call reporting portal once there has been activity on an agent’s handset.
Percentage gain can be specified per extension as the percentage mark-up on the cost of calls made by that user. For example, this field could be used to set a VAT rate for each extension, for billing purposes.
The rental cost is a fixed charge specified per extension. This fee is applied to an extension when running an extension cost report (in Revenue and Billing Reports).
Extension archiving enables archiving of extensions. It ensures that a new member of staff using a previous staff member’s extension number does not have historic calls assigned to them. For example, extension 235 becomes extension 235_username when archived for audit purposes. All historic calls will be appended with extension 235_username. Extension 235 then becomes available for the new starter with no call history attached.
Users can add, edit or delete DDIs as well as assign DDI names and Groups. Data is scheduled every night to sync all DDI information from the phone system to the software.
DDI Groups can be created in the DDI Group menu in order to assign multiple DDIs to one group.
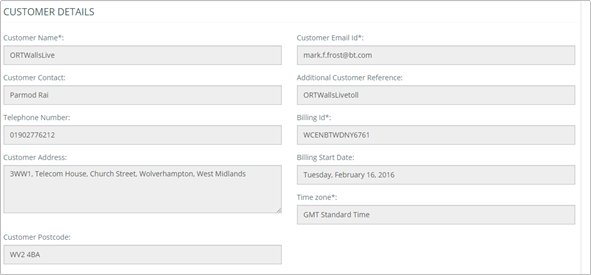
Users can add, edit or delete customer details such as company name, contact name, contact number and job title for every customer.
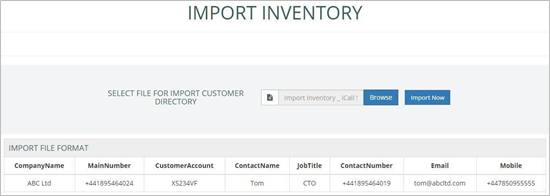
To import a customer directory, go to Import Inventory. The Import Inventory screen displays the recommended format of data prior to upload.
To upload your data, format your data accordingly, browse your computer to locate the file, select the data you are uploading and click ‘Import Now’.
To import/export directories select the User menu in Configuration then click on the sub menu ‘Import/Export Directory’.
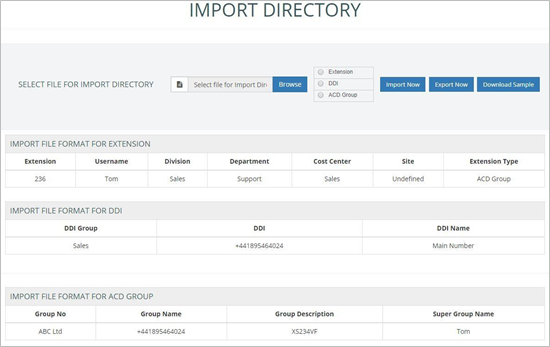
The Import Directory screen displays the format data should be in prior to uploading. It is possible to download a sample file to use as a template:
- Select extension/DDI/ACD group
- Click ‘Download Sample’.
To upload your data, format your data accordingly, browse your computer to locate the file, select which data you are uploading then click ‘Import Now’.
To edit your current directory, firstly export the data using the ‘Export Now’ button, edit the file accordingly, then upload your data following the steps above.
The logins section allows users to setup user accounts for the system, based on the number of supervisor licenses you have ordered on the Order form.
Throughout the system, user accounts provide access to the software Interface and define the level of access specific users have to the system.
There are 4 types of user:
- Super-user (Supervisor) - This user has full access to the portal and is the mandatory Supervisor that is set-up. Compliance access can only be granted to Super Users, using the ‘yes/no’ selection tool on the Edit Login screen. This provides authorised users access to compliance management. When access has been granted, the Compliance section in Configuration will become visible.
- Restricted User (Additional Supervisor) – This is an additional Supervisor User that has access to the entire portal (excluding the configuration section). Access can be restricted, so the user can only access analytics for users that are assigned to a specific reporting level(s).
- Insight User (Dashboard User) - This user can access the Business Insight Console only according to the specific groups that they belong to (e.g. departments, divisions, sites). Insight Console will just show pre-defined reports, dashboards and wallboards.
- My Console User - This user can only view call information based on their own extension.
Once logins have been created within the software, users will need to assign extensions to login roles to define access rights and supervisor types (groups).
This section allows users to view tasks that have been scheduled. Users can see the first run time for each scheduled task.
By clicking the edit option, users have the ability to change the time and date of the scheduled task as well as the run interval. Users can also add or remove email addresses of those that should be sent the report.
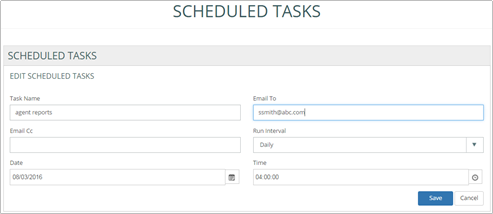
Each task can be assigned multiple actions. For example a Manager may wish to receive reports from various departments (actions) on the same date each month (the task). Scheduled actions for each task can be viewed or deleted in this section.
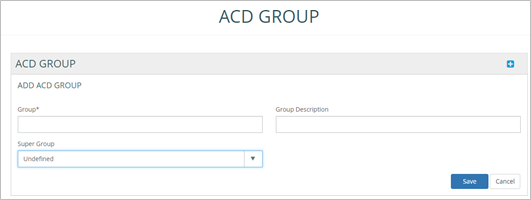
ACD Groups and Super Groups can be added to generate reports using the filter ‘All Contact Groups’.
A new ACD group can be added in this section. Each ACD Group should be assigned to a Super Group.
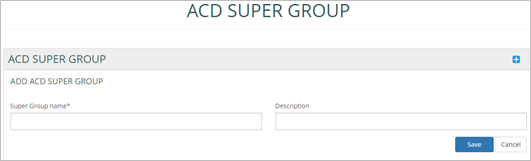
A new ACD super group can be added in this section. Super groups added here appear in the ACD Group list > Super Group field.
This section enables users to name Accounts and Account Groups to generate reports based on the filter ‘All Accounts’ and ‘All Account Groups’.
Users are able to add an account and assign each account to an account group.
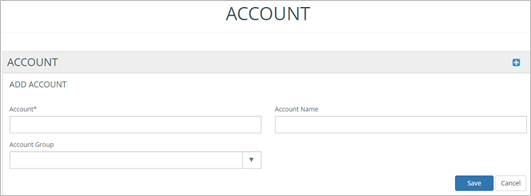
Account Groups can be added in this section and will then appear in the list of account groups in the Add Account > Account Group field.
In this section, call charge tariffs for area codes can be managed.
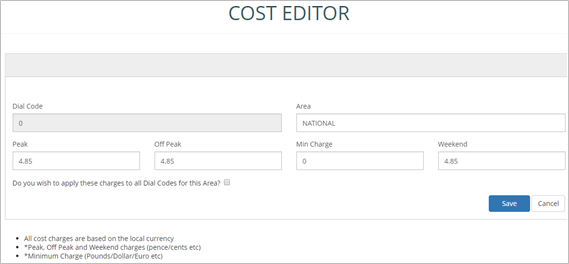
- Peak Rates: The peak time-period is when most calls are made. All calls between 09:00 hrs to 18:00 hrs are charged the peak rate per minute defined in this field.
- Off Peak Rates: Off-peak rates are applied outside of the peak time-period. All calls between 18:00 hrs to 09:00 hrs are charged the off-peak rate per minute defined in this field.
- Weekend Rates: Weekend rates are applied on a Saturday and Sunday.
- Minimum Charge: The minimum charge for any call dial code can be specified. As an example, if the peak rate is 4.85 and the call duration is less than two minutes, the minimum call charge would apply because the cost of the call did not reach the minimum charge:
- Peak Rate: 4.85 | Call Duration: 1:50 minutes (1.8) | Minimum Charge: 10
- * 1.8 = 8.88 (which is below the minimum charge defined).
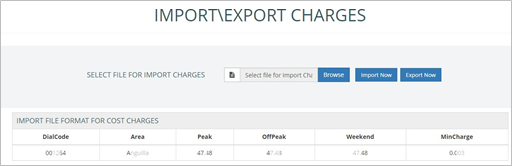
Charges can be applied to individual dial / area codes in this section. The values can be specified in any currency / denomination (as any numeric value) but should all be specified in the same denomination. Calls charges are per minute based on the value defined for each dial / area code.
Charges can be imported or exported directly instead of adding them individually. Please note, the file should be in .CSV format.
This section enables KPI parameters, trading hours and access codes to be specified.
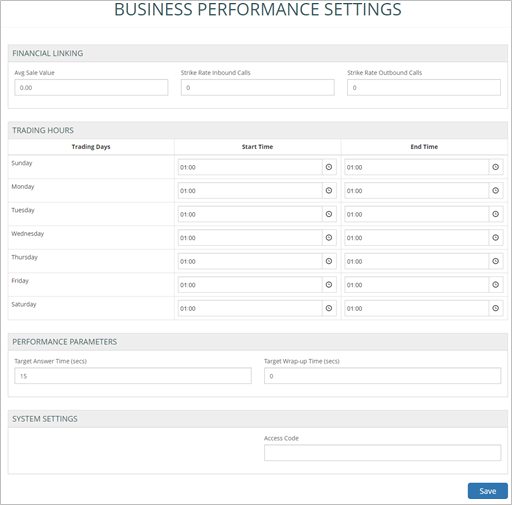
- Sale Value: Estimated value of a sale made as a result of a call (the value of the call).
- Strike Rate Inbound Calls: Estimated success rate of an incoming sales call.
- Strike Rate Outbound Calls: Estimated success rate of an outgoing sales call.
Trading Hours
Trading hours can be defined for the working week. Trading hours defined in this section are applied to relevant reports and in filters (trading / non-trading hours) so reports can be generated for specific business hours. For example, weekend data can be excluded from reports to exclude any irrelevant data, such as a missed call at midnight or on a Sunday.
The Target Answer Time and Target Wrap-Up Time can be specified (in seconds). The option is also available to synchronise sites or departments with the telephony platform. Please be aware that any manual changes undertaken within the application will be overwritten if this option is selected.
An ‘Access Code’ is a call prefix or dial code used to connect to an outside call or extension. The access code specified is automatically removed from reports that display outgoing numbers.
For example, if a user dials ‘9’ to make an outgoing call then dials ‘01712xxxxxx’, the number displayed on a report would be ‘01712xxxxxx’, without any access code.
The compliance section provides access to audit reports and masked CLIs. Extension archiving is also a compliance feature which is accessible only to super users / compliance users.
This section displays an audit log showing any changes committed on the portal in a specified period (all user changes that are audited and can be tracked). The audit log can be filtered by Date or User or Entity or Action. These audit reports can be downloaded as PDF or CSV file
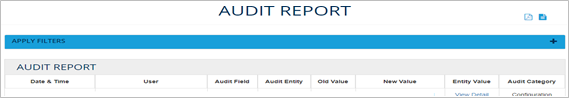
- Audit Field: The field that has been updated by the user and has been audited. It can be any field on the portal.
- Audit Entity: The field entity that has been updated, such as, Call Record, etc.
- Old Value: The old value in the field (before the update).
- New Value: The new name/value of the field.
- Entity Value: This contains the exact value that has been changed. A ‘View Detail’ link appears in this section where the Audit entry contains multiple changes. Click on View Detail to view all changes/deletions for this audited entry.
- Audit Category: This is the section of the portal in which changes have been made, such as Configuration.
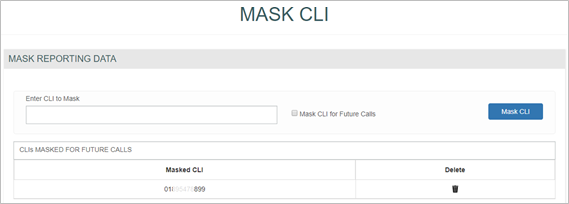
Numbers can be added to the list of excluded CLIs to exclude the number from reports. When added to the list, the last five digits of any number are masked with an asterisk (*) in historical data. To mask number in future call data the checkbox ‘Mask CLI for Future Calls’ should be ticked. A number added to the list of CLIs masked for future calls can also be deleted from the list.
Extension archiving enables archiving of extensions. It ensures that a new member of staff using a previous staff member’s extension number does not have historic calls assigned to them. For more details see the Configuration > User section of this guide.
WHC Call Analytics features are accessed via the top menu bar, all of which are covered off in the relevant section headings below.
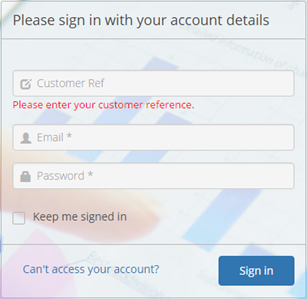
To log on visit the application portal URL, then enter your customer reference, email address and password (which are supplied via email during the provisioning process).
On first login, you will be asked to agree to the End User License Agreement. The language of the agreement will be determined by the language chosen on the login page. To change language from UK English, click the flag at the top of the screen, then select the required language. The language can also be changed from within the application in the same way.

User Notifications appear at the top of the Home page. A User Notification contains information of server maintenance or portal upgrades/planned maintenance.
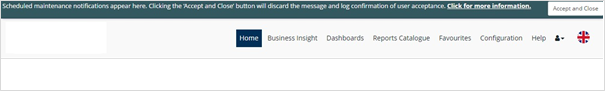
- Click for more information: Click on this link displays complete details of the
- Accept & Close: Use this to stop the notification from displaying at the top of the page. Once a notification is accepted and closed, it no longer appears for the user until the next upgrade or user notification is
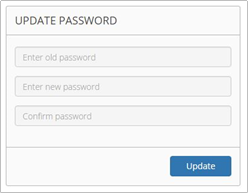
If you forget your password, please click on the ‘Can’t access your account?’ link which will take you through the password recovery process. To change your password, click on the ‘user’ icon then select ‘change password’. Please enter your old password, your new password and then confirm your new password.
To log out, click the ‘user icon’ then select ‘log out’.

The Home screen allows users to navigate through different sections of the software as shown in the screenshot below.
Business insight
The Business Insight section of the software provides an intuitive business productivity tool enabling inbound and outbound calls to be monitored via pre-defined dashboards and a wallboard.
Business Insight is split into multiple sections which combine live tiles and reports to provide call information on the entire business. Users are able to filter this section by date/time, extension, group, DDI or call type and download the Business Insight Summary as a PDF.
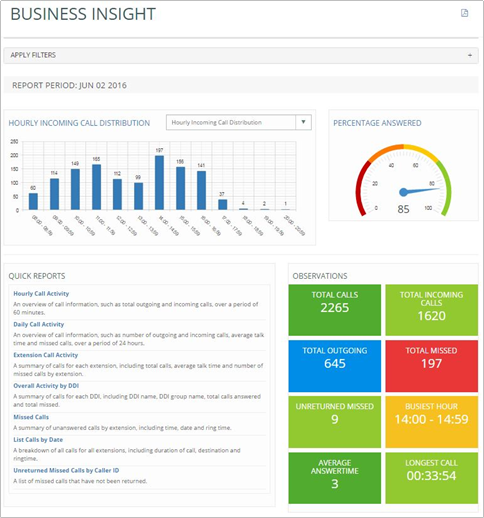
This bar chart displays hourly call traffic which allows users to see which hours of the day are busiest. The bar chart drop down provides options to display hourly incoming call distribution, hourly outgoing call distribution, or hourly call distribution.
This speedometer provides the percentage of the calls answered within target response time over the total calls answered by the business.
The quick reports section is a repository of report templates. Once run, the reports can be customised by using filters.
- Hourly Call Activity: An overview of call information, such as total outgoing and incoming calls, over a period of 60 minutes.
- Daily Call Activity: An overview of call information, such as number of outgoing and incoming calls, average talk time and missed calls, over a period of 24 hours.
- Extension Call Activity: A summary of calls for each extension, including total calls, average talk time and number of missed calls by extension.
- Overall Activity by DDI: A summary of calls for each DDI, including DDI name, DDI group name, total calls answered and total missed.
- Missed Calls: A summary of unanswered calls by extension, including time, date and ring time.
- List Calls by Date: A breakdown of all calls for all extensions, including duration of call, destination and ring time.
- Unreturned Missed Calls by Caller ID: A list of missed calls that have not been returned.
Live tiles display call information on total calls within the business, total incoming/outgoing calls, total missed, unreturned missed calls, busiest hour, average answer time and longest call. By clicking on a tile the relevant report will display in a new tab, providing further detail. For example, by clicking on the unreturned missed calls tile, the detailed unreturned missed calls report will be displayed.
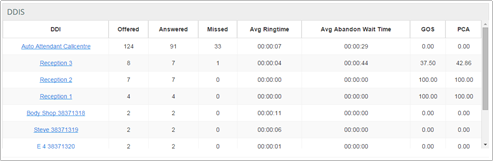
This report displays a summary of total calls for each DDI including total calls offered (including missed calls), answered and missed, as well as average ring time, average abandon wait time, Grade of Service (GoS) and Percentage Calls Answered (PCA). Grade of Service (GOS) displays total calls answered within the target response time over total calls offered and Percentage Calls Answered (PCA) displays the percentage of calls answered within the target response time over total calls answered for the day.
Users are able to click on a DDI name to view the ‘list calls by date’ report which displays a breakdown of calls by extension and user, including the date/time of call, duration, area, DDI, ring time and call type. This report can be used to analyse call flow and can be saved as PDF/CSV or emailed to any email address instantly.
This report displays a call summary by extension / user, including total calls, total incoming, total outgoing and total missed calls.
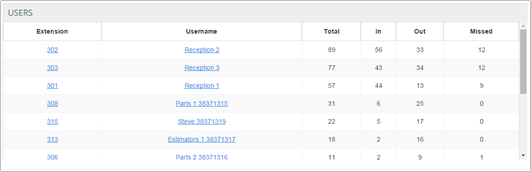
By clicking on an extension number, the ‘list calls by date’ report will be displayed, filtered by that particular extension. The report displays a breakdown of calls for this extension, including the date/time of call, duration, area, DDI, ring time and call type. This report can be saved as PDF/CSV or emailed to any email address instantly.
The Insight Wallboard provides 3 pre-defined wallboards, displayed in three size formats:
- DDI Summary: This wallboard displays the number of total calls, total missed calls, ring time and total talk time for each DDI.
- Extension Summary: This wallboard displays the number of total calls (incoming and outgoing), total missed calls and total talk time for each extension within the business.
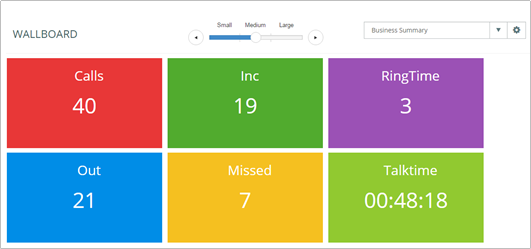
- Business Summary: This wallboard simply displays the total incoming/outgoing calls, total missed calls, average ring time and total talk time for the entire business.
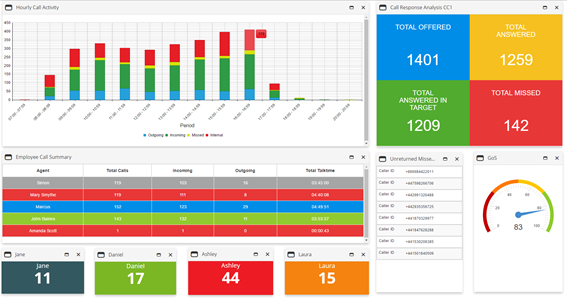
The dashboard section delivers wallboards for fast access to regularly used statistics, enabling users to view real-time data and historical data.
The Standard Wallboard provides essential call information, including total calls (outgoing and incoming) and an overall business summary including total answered, unreturned and missed as well as Grade of Service.
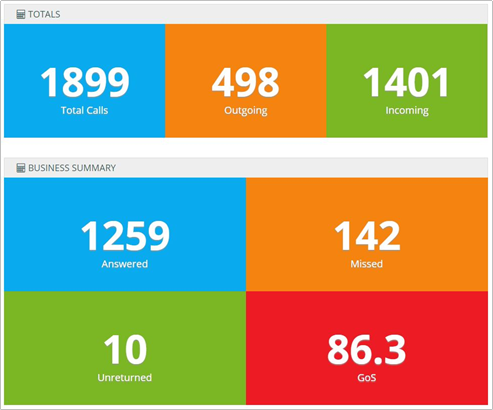
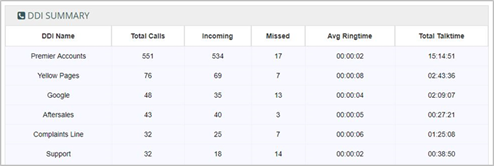
Below the call summary tiles is more detailed call information on DDIs, including total calls, total incoming and missed, average ring time and total talk time:
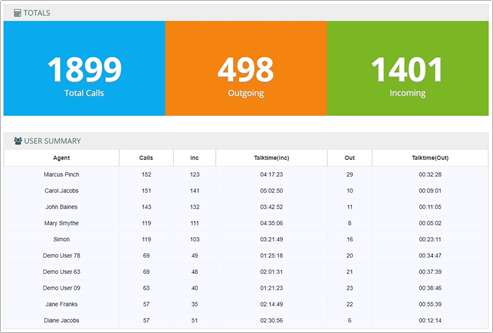
The business summary alternates with a user summary which details calls and talk time (incoming and outgoing) per user.
The Insight Wallboard can be accessed via the Dashboards section to view the following pre-defined wallboards. Displayed in three size formats:
- DDI Summary: This wallboard displays the number of total calls, total missed calls, ring time and total talk time for each DDI.
- Extension Summary: This wallboard displays the number of total calls (incoming and outgoing), total missed calls and total talk time for each extension within the business.
- Business Summary: This wallboard simply displays the total incoming/outgoing calls, total missed calls, average ring time and total talk time for the entire business.
The Executive Summary is a high level report that collates call information from multiple reports to provide useful observations & recommended actions.
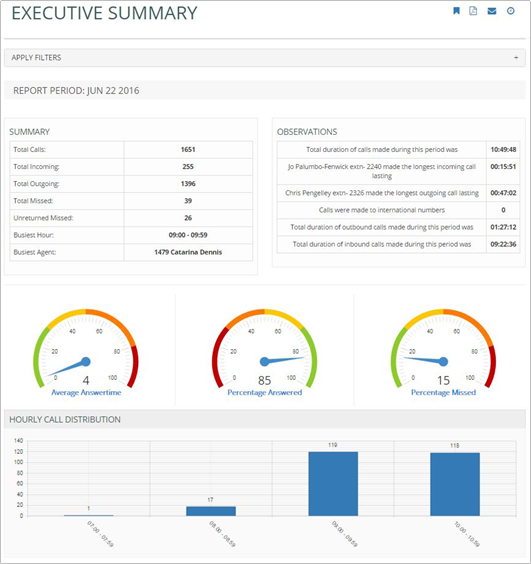
The report is divided into the following sections:
- The Summary shows the total calls, total missed calls statistics, busiest hour and busiest agent.
- The Observations section provides brief information on the longest incoming/outgoing call lasting, number of calls made to international numbers and total duration of outbound calls made.
- The Average Answer Time monitor shows the average answer time of the total calls.
- The Percentage of Calls Answered monitor shows the percentage of calls answered within the target response time over total calls answered.
- The Percentage Missed monitor simply displays the percentage of calls missed by the business.
- The Hourly Incoming Call Distribution shows the total incoming calls by each hour in a bar chart.
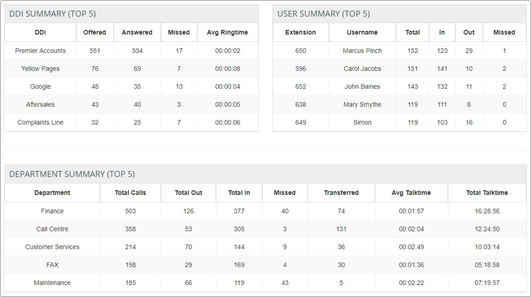
Below the Hourly Call Distribution graph are the following tables:
- The Top 5 DDI Summary shows total calls offered, answered, missed and average ring time for top 5 DDIs.
- The Top 5 User Summary shows the top 5 extensions that have the highest number of calls
- The Top 5 Department Summary shows brief information on departments such as total calls and average talk time
My Dashboard allows users to create, collate and display live tiles (configurable report components) on a customised dashboard, presenting up -to -date call data specific to requirements. Each login has its own ‘My Dashboard’ display.
The My Dashboard menu minimises to a vertical grey bar on the left side of the screen. There are two modes; active and inactive.
- When the display is active, the My Dashboard elements refresh and are fixed to provide a view which can be displayed on a screen or desktop.
- When the display is inactive, tiles can be added, deleted, resized or replaced to customise the dashboard in line with the user’s needs / role. In inactive mode the My Dashboard elements do not refresh.
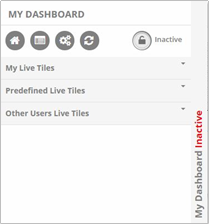
My Dashboard menu options include:
- Home: Go to the home menu screen.
- Create Live Tile: Create a new tile to add to the dashboard.
- Import profile: Replace the My Dashboard layout with another user’s My Dashboard by selecting the user whose profile should be imported. Profiles are automatically saved for each user, based on the latest My Dashboard layout.
- Refresh: Refresh the screen to show recently created live tiles and the latest Inactive My Dashboard layout.
Active / Inactive: Toggle between the My Dashboard display mode or edit mode.
The menu also displays a list of My Live Tiles (those created by the user), predefined live tiles and Other Users’ Live Tiles which can be selected and added to the My Dashboard display by clicking the tile name or using the round ‘Load Live Tile’ button. Any tile can easily be removed from the display (in Inactive mode) by clicking the ‘x’ in the corner of the tile.My Dashboard menu options include:
To delete a live tile from the list, click the ‘no entry’ symbol next to the relevant tile in ‘My live tiles’. It is not possible to delete another user’s live tile.
The live tiles available to place on My Dashboard vary depending on the product version.
Live tiles can be created either from a report or using the ‘Create Live Tile’ icon in the My Dashboard menu.
Creating Live Tiles from Reports
Live tiles are configurable report components that enable users to view real-time data or historical data in a concise fashion. Live tiles use a number of graphical components such as wallboards, speedometers, tables, charts and reports.
After clicking on the ‘Create Live Tile’ icon, the user will be presented with the screen below:
Firstly the live tile should be named so it can be easily identified from the ‘My Live Tiles’ list in the dashboard section.
The live tile will appear in the list of ‘My Live Tiles’ in My Dashboard. From there it can be added to the the display.
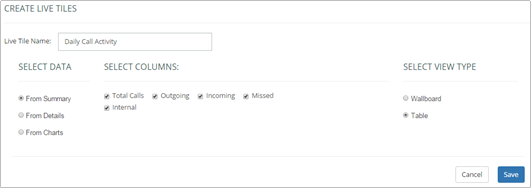
- Users can specify exactly which data they wish to appear on their custom live tile. Data can be selected from the report summary tiles at the top of the report, the report details or from the report graphs.
- Once data has been selected, the user can select a view type. Options such as wallboard, table, chart and speedometer will be available depending on the type of data that has been selected.
Creating Live Tiles using the Create Live Tile icon in the My Dashboard menu
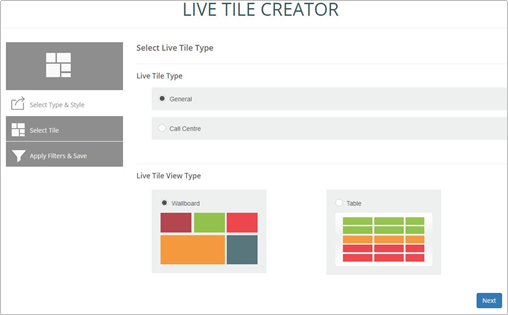
The Live Tile Creator is a wizard that enables live tiles to be created, to add to My Dashboard. To access the Live Tile Creator go to the ‘Create Live Tile’ menu in the top of the My Dashboard menu.
Follow the steps in the wizard to create your live tile:
- Select your live tile type (general business analytics or call centre analytics) and style (wallboard or table).
- If Wallboard is selected, choose which metric the wallboard tile should display in the tile. If table is selected, choose the data to include (department, division, extension, or returned missed call data) then select the columns for the table.
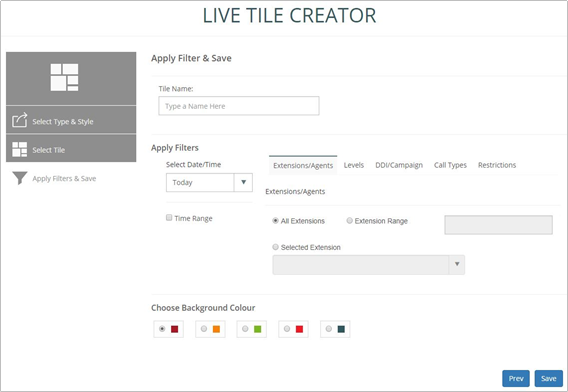
The final steps are to:
- Enter a name for your live tile (this name will appear in the list of ‘My live tiles’ in My Dashboard and will be the name of the actual tile)
- Select filters to refine data in line with requirements.
If a wallboard tile is created, a background colour for the tile should also be selected.
Once the system message appears to confirm that the live tile has been created, close the browser tab and return to My Dashboard.
Please refresh the list of ‘My Live Tiles’ to view recently created tiles (using the refresh icon at the top of the menu bar). The new live tile can then be added to the My Dashboard display.
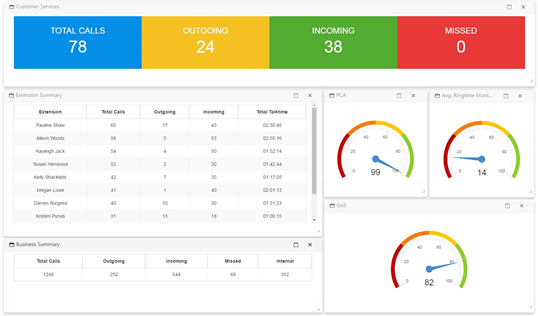
My Dashboard (Premier Edition)
The live tiles available to place on My Dashboard vary depending on the product version. For premier edition users, contact team analytics can be added to My Dashboard to view live call analytics.
Contact Wallboard (Premier Edition)
The Contact wallboard is only accessible to premier edition users. This wallboard is divided into 4 elements to provide live call information on the Contact Centre:
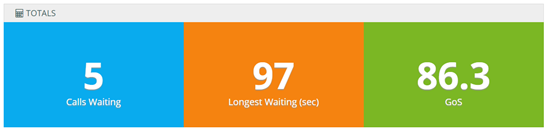
Totals: The top section displays the total calls waiting, longest waiting time in seconds and Grade of Service:
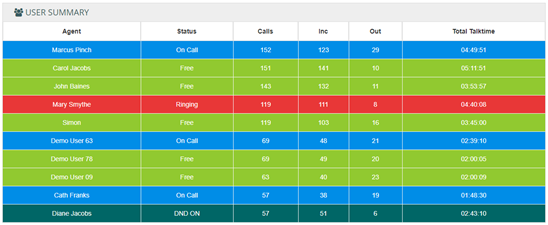
- User Summary: This wallboard displays live call information and a summary of each user’s current call status (e.g. free or on call), total incoming/outgoing calls and total talk time.
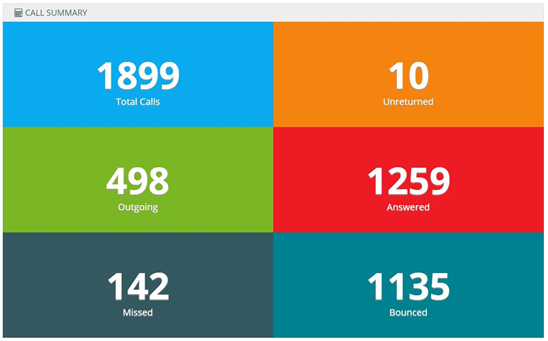
- Call Summary: The call summary provides information on total calls, total outgoing and answered calls, total missed calls and total unreturned, and total calls bounced (the call rings on an extension but the call is answered by another extension. Please note: a bounced call might ring on multiple extensions; one extension shows the call as answered and the other extensions are shown as a bounce).
- Live Calls: The final section displays current calls in progress within the business. The wallboard provides information on the direction of the current call (outgoing or incoming), extension name, DDI / Group, Caller ID, current call status (ringing or on call) and time in current status. The following legend can be used to understand the colour-coding of the Contact Wallboard elements:
|
Call Status Key |
|
|
Green |
Free |
|
Blue |
Outgoing Call |
|
Red |
Incoming Call |
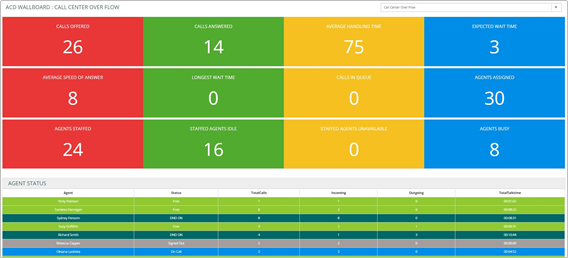
ACD Wallboard
The ACD wallboard displays the following call statistics for a selected group:
Below the live tiles is an Agent status summary showing total calls (incoming and outgoing) and total talk time
- Calls Offered: Total number of calls presented, which were either bounced, answered or overflowed after being offered.
- Calls Answered: Total number of calls answered by an agent.
- Average Handling Time: The average time it takes to process a call in the queue.
- Expected Wait Time: The estimated time a caller has to wait in the queue before their call is answered.
- Average Speed of Answer: The average time a caller spends in the queue. This is the total wait time plus the total ring time for the calls answered during the interval, divided by the number of calls answered during the interval.
- Longest Wait Time: This is the waiting time of the call that has been in the queue the longest.
- Calls in Queue: The total number of calls in the queue to be answered.
- Agents Assigned: The number of agents assigned to this call centre.
- Agents Staffed: The number of agents that are in Sign-In, Available, Unavailable or Wrap-Up state.
- Staffed Agents Idle: The number of staffed agents that are not on a call.
- Staffed Agents Unavailable: The number of staffed agents that are unavailable.
- Agents Busy: Number of agents that are currently on a call.
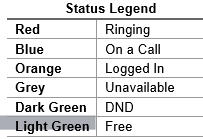
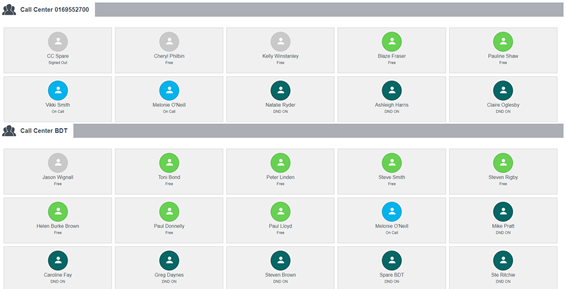
The Group View wallboard displays an overview of contact groups and the status of users within them. The ‘Status Legend’ explains the colours used in the Group View wallboard:
The Reports Catalogue is a repository of report templates that provides a starting point and recommended reports.
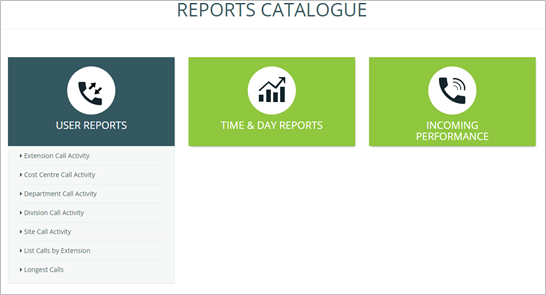
The following section details the categories of reports and an explanation of each report available to users.
This folder contains reports based on the performance of individual extensions and the groups they are part of, such as cost centre, department and division.
This report displays a summary of call information by extension, to understand call activity by extension across the business. The report summary displays the total calls, total outgoing, total incoming, total missed and total internal calls. The report details table displays a breakdown of total calls (outgoing, incoming, missed, internal) by extension and user, average talk time, average incoming and outgoing talk time and total talk time.
This report displays a summary of call information by cost centre to view which cost centres are busiest within the business.
The report summary displays the total calls, total outgoing, total incoming, total missed and total internal calls. The report details table displays a breakdown of total calls (outgoing, incoming, missed, internal) by cost centre, including call destination type, average talk time, average incoming and outgoing talk time and total talk time.
This report displays a summary of call information by department to see which departments are busiest within the business.
The report summary displays the total calls, total outgoing, total incoming, total missed and total internal calls. The report details table displays a breakdown of total calls (outgoing, incoming, missed, internal) by department, including call destination type, average talk time, average incoming and outgoing talk time and total talk time.
This report displays a summary of call information by division to see which divisions are busiest within the business. The report summary displays the total calls, total outgoing, total incoming, total missed and total internal calls. The report details table displays a breakdown of total calls (outgoing, incoming, missed, internal) by division, including call destination type, average talk time, average incoming and outgoing talk time and total talk time.
This report displays a summary of call information by site to see which sites are busiest within the business. The report summary displays the total calls, total outgoing, total incoming, total missed and total internal calls. The report details table displays a breakdown of total calls (outgoing, incoming, missed, internal) by site, including call destination type, average talk time, average incoming and outgoing talk time and total talk time.
This report displays a breakdown of calls for every extension, including every call made/received, the date/time, number and call duration. This report can be used to analyse call flow. For example, users can see which calls were transferred to another extension and how many calls were missed by that extension.
The report details table displays a breakdown of calls by extension, department and user, including the date/time of call, duration, area, DDI, ring time and call type.
This report displays a breakdown of calls for all extensions by duration. The report summary displays the duration of the longest call and the relevant user. The report details table displays a breakdown of calls by extension, user and department, including the date/time of call, duration, number, area, DDI, ring time and call type.
This folder contains reports based on daily, half-hourly, hourly and monthly call activities so users can determine which periods are busiest for the business.
This report displays a breakdown of all calls for all extensions, including call duration, area and ring time.
This report can be used to analyse call flow. For example Users can see when the call was answered by the receptionist, which agent the call was transferred to and on which agent the call ended.
The report summary displays the total calls, average duration and average ring time. The report details table displays a breakdown of calls by extension and user, including the date/time of call, duration, area, DDI, ring time and call type.
This report displays a summary of call information in periods of 30 minute intervals, including total, outgoing and incoming calls. This report is useful to show busy periods in the day.
The report summary displays the total calls, total outgoing, total incoming, total missed and total internal calls. The report details table displays a breakdown of calls by interval and includes average talk time, average incoming and outgoing talk time and total talk time.
This report displays a summary of call information in periods of 60 minute intervals, including total, outgoing and incoming calls. This report is useful to show busy periods in the day.
The report summary displays the total calls, total outgoing, total incoming, total missed and total internal calls. The report details table displays a breakdown of calls by interval, including average talk time, average incoming and outgoing talk time and total talk time.
Hourly Call Activity by Extension
This report displays a summary of call information in periods of 60 minute intervals per extension, including total, outgoing and incoming calls. This report is useful to show busy periods in the day.
The report summary displays the total calls, total outgoing, total incoming, total missed and total internal calls. The report details table displays a breakdown of calls by interval, extension and user, including average talk time and average incoming talk time.
This report displays a summary of daily call information, including total, outgoing and incoming calls. The report summary displays the total calls, total outgoing, total incoming, total missed and total internal calls. The report details table includes average talk time, average incoming and outgoing talk time and total talk time.
This report displays a summary of monthly call information, including total calls, total missed calls and average talk time. This report is useful to identify which months of the year are busiest.
The report summary displays the total calls, total outgoing, total incoming, total missed and total internal calls. The report details table displays a breakdown of calls by month, including average talk time, average incoming and outgoing talk time and total talk time.
This folder contains reports that can be accessed by users to see their incoming call statistics, such as target response time, grade of service and percentages missed/answered within the target response time for the day. Missed call reports are also available in this section.
This report displays call information for hourly intervals. The report provides detailed information such as total calls answered in target time, percentage of calls missed and grade of service.
- Target Answer Time: This is a threshold period within which an agent must answer the call to achieve good customer service. The target answer time can be set in configuration > system settings > target answer time.
- Grade of Service (GOS): Total calls answered within the target response time over total calls offered.
- Percentage Calls Answered (PCA): Percentage of calls answered within the target response time over total calls answered for the day.
The report summary displays the total calls offered, total answered, total answered in target and total missed as well as Grade of Service (GoS), Percentage Calls Answered (PCA) and percentage of calls missed.This report can be used to determine the call response for agents within the business by hour. Users can see the total calls offered to the business and whether the calls have been answered within the target answer time or if any calls have been missed.
The report details table displays a breakdown of calls by hourly interval, including calls offered/answered, calls answered in target, missed calls, total and average talk time, average answer time, average abandon wait time, GoS, PCA and percentage missed.
This report displays customer waiting time in seconds and total calls lost. The report provides insight on how long a customer is prepared to wait for their call to be answered. Users can add a comfort message for customers at these peak times to cut down on lost calls.
This report displays a summary of unanswered calls, the extension that missed the call and how long the customer waited before abandoning the call (ring time).
The report summary displays the total calls and average ring time. The report details table displays a breakdown of missed calls by extension, DDI, user, cost centre, department and division, including the date/time of call, duration, number, ring time and call type.
This report provides a list of missed calls that have not yet been returned in order to highlight busy periods where agents are unable to answer calls. Users are able to see the calls that have been missed, which extension missed the call and how long the customer waited before abandoning the call (ring time). This report can be used to return missed calls to improve business efficiency and customer satisfaction. Once the call has been returned it will no longer appear on the report.
The report summary displays total calls and average ring time. The report details table displays a breakdown of missed calls by extension, user, department and DDI as well as the date/time of call, ring time and call type.
Unreturned Missed Calls by Caller
This report shows the total number of unreturned missed calls (calls not yet returned by the business) and details total unanswered calls for each Caller.
This folder contains reports on the performance of individual DDIs and the campaigns they are associated with.
This report displays a summary of incoming call information by DDI, including number of calls answered within the target time, total calls, percentage of calls missed and average talk time.
The report summary displays the total calls offered, total answered, total answered in target, total missed, percentage of calls missed, GoS Grade of Service and PCA Percentage Calls Answered (see Call Response Analysis report for GoS and PCA definitions). The report details table displays a breakdown by DDI, DDI name and DDI group of calls offered, answered, answered in target and missed, including total talk time, average talk time, average answer time, average abandon wait time, GoS, PCA and percentage calls missed.
This report displays a breakdown of calls by DDI and is useful to analyse call flow to individual DDIs.
The report summary displays total calls and total duration. The report details table displays a breakdown of calls by DDI, DDI name, extension and user, including the date/time of call, duration, number, ring time and call type.
This report displays a breakdown of calls by campaign and is useful to analyse call flow to DDI groups.
The report summary displays total calls and total duration. The report details table displays a breakdown of calls by DDI group (campaign), DDI, DDI name, extension and user, including the date/time of call, duration, number, ring time and call type.
This report displays a summary of daily call information by DDI, including number of calls answered within the target time, total calls, percentage of calls lost and average talk time.
The report summary displays the total calls offered, total answered, total answered in target, total missed, percentage of calls missed, GoS Grade of Service and PCA Percentage Calls Answered (please see Glossary of Call Types and Call Flows for definitions). The report details table displays a daily breakdown of calls offered, answered, answered in target and missed, including total talk time, average talk time, average answer time, average abandon wait time, GoS, PCA and percentage calls missed.
This folder contains reports that display call information on area code and destination.
This report displays call information grouped by area code. The report summary shows the area with the highest number of calls. The report details table displays a breakdown of total calls and total duration by area code, and includes outgoing/incoming calls and average duration.
This report displays call information on total calls and duration by destination. This report is useful to view total calls made to and from a specific destination e.g. local and national calls.
The report summary highlights the area with the highest number of calls. The report details table displays a breakdown of total calls and total duration by area, and includes outgoing/incoming calls and average duration.
This folder contains reports based on the customer contacts that have been imported from the configuration section of the product. Customer contacts can be added in the configuration section under customers > customer directory.
This report displays a summary of call information for customer contacts, to understand frequency of customer contact, for customer retention analysis.
The report summary displays the total calls, total outgoing, total incoming, total missed and total internal calls. The report details table displays a breakdown of calls (total, outgoing, incoming, missed) by number and contact name, including average talk time, average incoming and outgoing talk time and total talk time.
This report displays detailed customer contact call information, including calls made/received, the date/time, number and call duration. This report enables users to analyse call flow by customer. Users can see who a call was answered by, if it was transferred and which extension completed the call.
The report summary displays total calls, total duration and average duration. The report details table displays a breakdown of calls by customer name and number, including details of extension, user, cost centre, department, division, date/time of call, duration, area, DDI, ring time and call type.
This folder contains reports that display potential revenue opportunities and billing information by extension and department. These reports can be useful for charging on the cost of calls to a particular extension.
- The call cost is calculated by applying the cost specified in the Cost Editor.
- The percentage gain (on the cost of the call) can be defined for each extension (Configuration > User > Extension) as well as the fixed rental charge.
The estimated revenue generated by extension or department is based on values specified in the Business Performance Settings section of Configuration.For example; the call duration of number ‘01739’ is 00:00:30. The Peak Value set in the Cost Editor is 4.85. Therefore, the call cost is calculated as 4.85 * 0.5 = 2.425 (rounded up to 2 decimal places) = 0.02. The percentage gain is applied to this cost, to calculate the total charge.Based on call tariffs in the Cost Editor (Configuration > Call Accounting > Cost Editor), calls can be rated using the call cost, gain and rental charge.
- The total estimated revenue is equal to the total estimated revenue outgoing and incoming. This total estimated revenue reflects the total potential revenue opportunity based on the total calls.
- The total estimated revenue on outgoing calls is the potential revenue opportunity on outgoing calls. This value is calculated based on the outgoing ‘strike rate’ as defined in System Settings > Business Performance Settings. For example; if the outgoing strike rate is 6 and the average sales value per call is 5.60, on 10 outgoing calls the estimated revenue on outgoing calls (Est. Revenue Outgoing) would be 9.33, calculated as follows:
- 10 calls / 6 = 1.666
- 666 * 5.6 = 9.333
- The total estimated revenue on incoming calls is the potential revenue opportunity on incoming calls. This value is calculated based on the incoming ‘strike rate’ as defined in System Settings > Business Performance Settings.
- The estimated revenue recoverable is the potential retrievable revenue opportunity on unreturned missed calls. If an unreturned missed call is returned, revenue could potentially be recovered for that call. This value is calculated using the sales value of a call, as defined in System Settings > Business Performance Settings, multiplied by the number of missed calls.
List Calls by Cost
This report lists outbound calls by extension and user, ordered by date and time of call.
The report summary displays the total number of calls, the total cost of calls and the total charge. The report details table displays a breakdown of call cost and percentage gain per user per extension. Listed for each call is the call duration, call type, call cost and percentage gain.
This report displays a summary of call cost by extension and user, detailing the average talk time, total talk time, rental charge for that extension, call cost, cost of gain (based on the percentage gain for that extension) and the total cost (including gain and rental). The report summary displays the total calls, total cost of calls and total charge including and excluding rental.
This report displays the total revenue opportunity by extension.
The report summary displays the total incoming, outgoing, missed and unreturned missed calls and the estimated total revenue opportunity (incoming / outgoing). The report details table provides a breakdown by user / extension of estimated potential revenue on calls and highlights the potential retrievable revenue opportunity on unreturned missed calls.
This report displays the total revenue opportunity by department.
This report summary displays the total incoming, outgoing, missed and unreturned missed calls and the estimated total revenue opportunity (incoming / outgoing). The report details table provides a breakdown by department of estimated potential revenue on calls and highlights the potential retrievable revenue opportunity on unreturned missed calls.
The following reports are available to premier edition users only.
This folder contains reports that display call information by contact group.
This report displays a summary of call activity by contact group. The report summary displays the total calls offered, missed and overflowed as well as the total direct and overflowed calls answered.
The report details table displays a breakdown of total calls offered, missed, overflowed and answered (direct and overflowed) by contact group, including average talk time and answer time per group.
This folder contains reports that display call information by agent.
Agent Summary by Contact Group
This report displays a summary of call activity by contact group. The report summary displays the total calls offered, missed and answered (direct and overflowed).
The report details table displays a breakdown of total calls offered, missed, bounced and answered (direct and overflowed) by contact group, including average talk time and answer time per group.
The report summary displays total calls offered, total answered (DDI, direct and overflowed) and total calls missed.
This report details table shows a breakdown of calls offered, answered (DDI, direct and overflowed), missed and bounced by agent, including total talk time and average answer time.
This report displays the total available time of each agent, including total calls, talk time and login time.
Available Agent Activity by Day
This report displays the total available time of each agent, including total calls, talk time and login time by day.
This folder contains reports on agent availability.
This report displays a breakdown of agent status by time and date.
This report displays a summary of agents’ time in break (with reason codes) by date.
This report displays a summary of time spent on DND by extension and user. This report is used to view how long an agent has been on DND throughout the day.
This report displays the date and time DND is activated or deactivated by extension and user.
Applying Filters to Reports
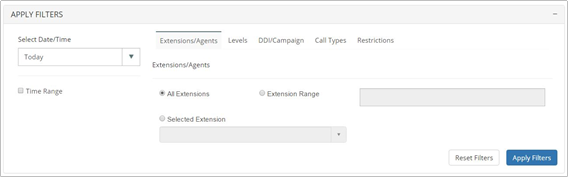
‘Filter’ is a very powerful tool that gives users the ability to narrow down call information to meet their reporting requirements. Filter options are available on any report and users can access this by simply clicking on ‘Apply Filters’ which presents the following screen.
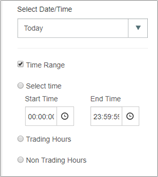
Users can apply date or time filters to analyse call information for a specific date or time period. Select the Date/Time drop down to select pre-defined dates / date ranges or input custom dates and times. This filter can be useful when searching for a call at a particular time/date.
This filter allows users to report on individual or multiple extensions/agents, helping to narrow report results to focus only on the extensions/agents of interest. Users have three options on this filter:
- All Extensions: Users can apply this filter to report on all extensions that are active. By default this option is always applied.
- Extension Range: Users can enter specific extensions (separated by a comma) or an extension range (using a hyphen).
- Selected Extensions: Users can select from the list of extensions detected during configuration of the software. Extensions can be selected from the list of ‘Available Extensions’ and moved across to the ‘Selected Extensions’ box using the arrows. Using this filter provides the benefit of viewing extensions by name.
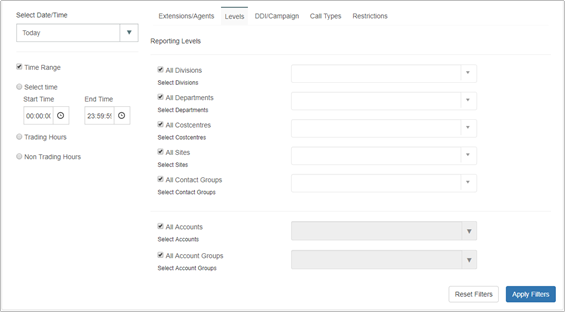
A reporting level group (division, department, cost centre, site contact group, accounts, account groups) contains multiple extensions to make it easier to create reports, rather than using filters to manually select multiple extensions.
The reporting level filter has six dropdowns for division, department, cost centre, site, contact group or account/account group. Users can limit reports to show all call data from a single group and/or select particular divisions/departments/cost centres/sites/groups/accounts or account groups using the dropdown list. All these groups are picked up from configuration of the product. By default all groups will be selected, however, users can untick a box to select from the dropdown.
A DDI is a direct dial number and a Campaign is a group of DDIs. Users can use this filter option to display call information to a specific DDI, Campaign, or multiple DDIs. Users can use this filter in scenarios where they need to see how many calls were offered to specific DDIs. There are three options available on this filter:
- All DDIs: Users can apply this filter to report on all DDIs across the software. By default this option is always applied.
- Restrict Campaigns: Users can use this dropdown to filter on Campaigns (a group of DDIs). Campaigns can be set up under Configuration>DDI>DDI Groups
- Restrict DDIs: The list of ‘Available DDIs’ contains all the DDIs configured in the software. DDIs can be selected from ‘Available DDIs’ and moved across to the ‘Selected DDIs’ box using the arrows to report on specific DDIs. Using this filter provides the benefit of viewing DDIs by name.
This is one of the most useful filters that allows users to remove certain call types from reports, for reporting on selected types of calls. This section has four options available:
- Incoming Calls: Users can filter incoming calls by answer status (Any, Only Answered or Only Unanswered), routing (Any, Only Transferred or Only Non-Transferred Calls) and/or to include or exclude bounced calls.
- Outgoing Calls: Users can filter outgoing calls by destination type (Local, National, International, and Mobile) and/or whether direct/transferred.
- Internal Calls: Users can filter reports to include or exclude internal calls (Any, Only Answered or Only Unanswered)
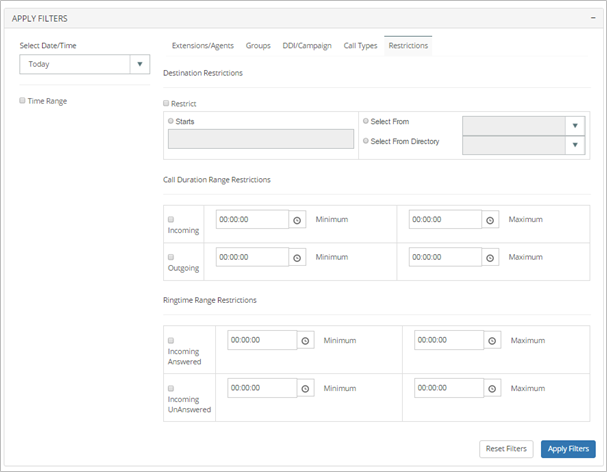
These are unique filters that provide extra functionality to narrow down the search further, by destination, call duration and ring time.
Users can restrict call information in the following three ways:
- Destination Restrictions: This filter restricts the report to calls to a specific number or a partial number. For example to only view calls starting with 0044 or to view calls to and from 00441895464019. Users are also able to search for individuals from the customer directory or to select everyone in a customer directory.
- Call Duration Range Restrictions: Users can choose to show only incoming and/or outgoing calls with a minimum or maximum specified call duration.
- Ring time Range Restrictions: Users can use this filter to only show calls with a minimum or maximum specified call ring time for either incoming answered or incoming answered calls.
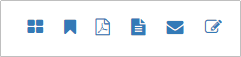
At the top of every report there are icons which enable users to create a live tile, save as a favourite, save as PDF or CSV, email report or schedule the report. Details of each action follow.

Any report within the product can be added to the Favourites section. Adding a report to favourites saves time as all the filters are saved and users can simply run the same filtered report with just one click from the Favourites section.
After clicking on ‘Add to Favourites’ the user will be presented with the screen below:
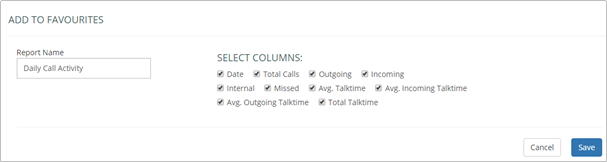
- Users can add a unique name to their report so it is identified from the Favourites section.
- Users can select/deselect columns they wish to add to their Favourite report.
This option allows users to save the reports they currently have open in either a PDF or a CSV format.
This option allows users to email the report instantly to any email address in either PDF or CSV format.
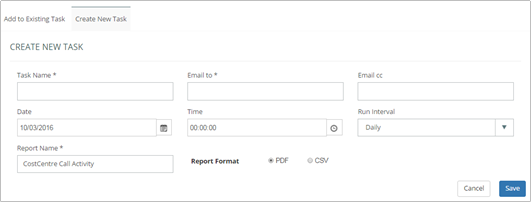
Reports can be scheduled and sent in the user’s selected language. Any report can be scheduled as a new task or added to an existing task.
Firstly, when creating a new scheduled report, the user should click on ‘Create New Task’ then allocate the task a name so it can be easily identified in the ‘Scheduled Task’ list in ‘configuration’. Further reports can be added to this task in order to provide one (or more) person(s) with multiple scheduled reports.
One or more email addresses can be entered, then the time, date and run interval for the report can be set. The report should be given a name and the format for the report (CSV or PDF) should be selected.
If the number of records in a report exceeds 20,000 the service will send the report in .csv format (zipped). If the number of records is less than 20,000, the pre-defined format is followed (pdf, html,).
A report can be added to an existing task through the ‘Add to existing task’ tab.
Existing tasks appear in a dropdown list to enable the user to select the task to which the report should be added. Details such as when the report will run, to whom the report is sent, and how often, will appear when an existing task is selected.
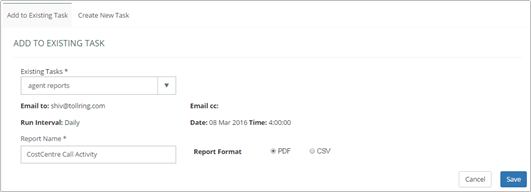
The user should allocate the report a name and choose the format of the report (PDF/CSV), then save the report to the existing task. Reports allocated to tasks can be edited / deleted in ‘configuration’.
All the Favourite reports created from the reports catalogue (using the favourites icon, found at the top of every report) will be available in this section.
Select a report name to view the report with the filters applied when it was saved to favourites.
This section provides links to online videos and user guides available, for users to gain a better understanding of the software.
Release notes for all previous and current releases can be found in the Release Notes section.
The release notes contain details of all new features, improvements and bug fixes for a particular release. Users can also read about changes and enhancements in the latest build.
Glossary of Call Types and Call Flows
Below is a glossary of terms used in the application:
Abandoned Calls: An abandoned call is a call that is ended before any conversation occurs, often because the caller is frustrated with the time on hold.
Bounced: Bounced calls are incoming calls that come to an extension but are not answered and therefore go to another extension until it is answered or the opposite party hangs up.
Call Cost The call cost is calculated by applying the call tariff specified in the Cost Editor.
Caller Tolerance: Caller Tolerance is the length of time a caller is prepared to wait for their call to be answered.
Estimated Revenue
Recoverable The potential retrievable revenue opportunity on unreturned missed calls. This will be calculated using the sales value of a call multiplied by the number of missed calls.
Grade of Service (GoS): Grade of Service is the total calls answered within the target response time over total calls offered.
I/T: Incoming transferred calls are calls that were picked up by an extension and then transferred to another extension.
I/U: Incoming unanswered calls are calls that were hung up before being answered by an agent or answered by the auto attendant and then hung up before being transferred to a group or extension.
INC: Incoming complete calls are calls that have been answered by an agent then completed. This record will show all the call information including the total duration and the final extension the call ended on.
INX: Internal calls are calls that were made within the business from one extension to another.
Minimum Charge This will be the charge applied to a call dial code, should the cost per minute X duration not reach this value. Once the cost per minute X duration exceeds this value, the actual cost will be displayed.
Missed Calls: Missed calls are unanswered calls.
OUT: Outgoing calls are calls made out of the business to an external number.
Percentage Calls Answered
(PCA): Percentage of calls answered within the target response time over total calls answered for the day.
Percentage Gain Percentage gain can be specified per extension as the percentage mark-up on the cost of calls made by that user, calculated using values set in Configuration > User > Extension.
Rental Cost The rental cost is a fixed charge specified per extension. This fee is applied to an extension when running an extension cost report (in Revenue and Billing Reports).
Ring Time: Ring Time is the length of time before a call is answered.
Target Answer Time: This is a threshold period within which an agent must answer the call to achieve good customer service. The target answer time can be set in configuration > system settings > settings.
Total Duration: The total length of a call from the time it is answered to the time the call is complete, including any transfers or time on hold.
Total Estimated Revenue The total of outgoing and incoming estimated revenue. This total estimated revenue reflects the total potential revenue opportunity.
Total Estimated Revenue
on Incoming Calls is the potential revenue opportunity on incoming calls. This value is calculated based on the incoming ‘strike rate’ as defined in System Settings > Business Performance Settings.
Total Estimated Revenue
on Outgoing Calls is the potential revenue opportunity on outgoing calls. This value is calculated based on the outgoing ‘strike rate’ as defined in System Settings > Business Performance Settings.
Total Talk Time: The total length of time talking on a call.
Unreturned Missed Calls: Unreturned missed calls are unanswered calls that have not yet been returned. Once the call has been returned it will no longer appear on a report as unreturned missed.
X/U: An internal call that is not answered.
I have forgotten my login details
Go to the login page and click on the link ‘Can’t access your account?’. Please follow the instructions to reset your password.
Why haven’t I received my scheduled report?
Please check your junk email settings and add smtpuser@tollring.com to your safe senders list.
I have updated the phone system phone book but the changes are not showing in the call analytics portal.
The changes will sync automatically and the system will be correct within 4 hours. To manually sync the data please go to the configuration area and click ‘BroadSoft Sync’.
Why can’t I see all extensions in the call analytics portal?
There could be 2 reasons for this:
- The extensions could be in an ‘undefined’ site or department.
- Your permissions might not allow access to all extensions. Please check your permissions level with your administrator.
Please log a support ticket so the team can investigate.
